
Establishing a Brand Measurement Framework: KPIs, Metrics & Models
Introduction
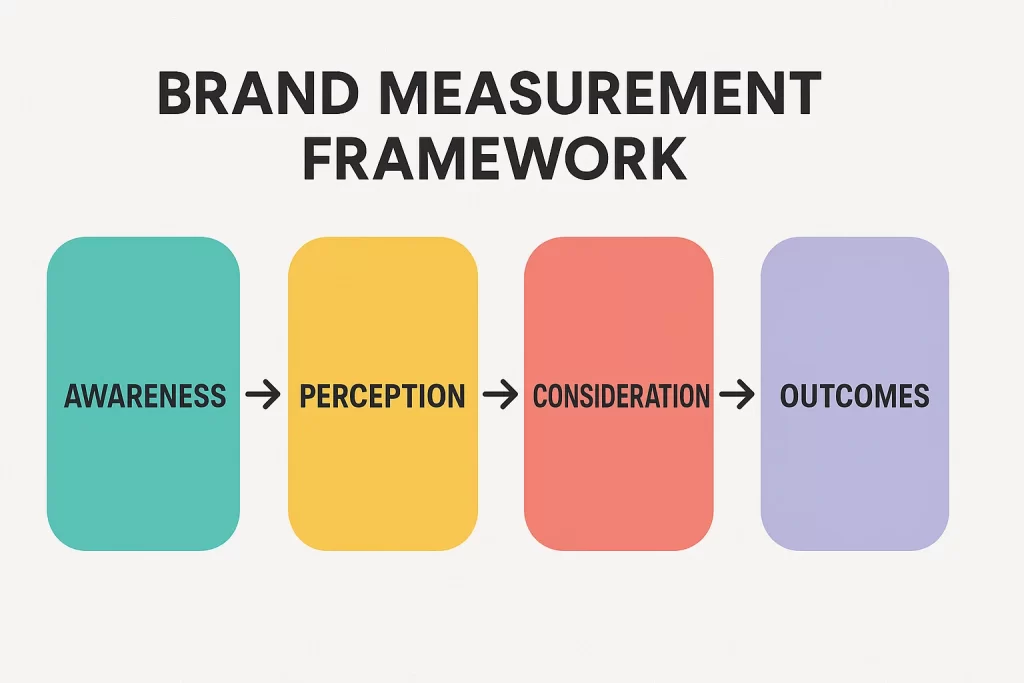
A brand measurement framework is a structured system designed to track and evaluate the performance of a brand across multiple dimensions—from awareness to loyalty. In a world flooded with metrics, businesses struggle to differentiate between vanity data and strategic insights. A scientific, cohesive model that aggregates expert-validated KPIs, multi-touch attribution logic, and brand health indicators is no longer optional—it is essential. According to a Nielsen study, 59% of marketers agree they do not have the right technology to measure ROI across channels. Meanwhile, Gartner reports that brands using integrated frameworks outperform peers by 25% in long-term brand equity.
With the evolution of marketing analytics and the increasing pressure on CMOs to justify branding spend, the need for a comprehensive brand measurement framework has never been more urgent. It’s not enough to simply monitor campaign performance; organizations must also understand the broader brand implications of their marketing decisions. This includes assessing intangible assets like brand trust, emotional resonance, and consumer preference. By integrating semantic SEO components like brand performance KPIs, brand measurement model, and KPI for brand performance, this article builds a future-ready measurement roadmap for CMOs and brand leaders, providing a strategic tool to align Brand Strategy & Execution effectively.
What Is a Brand Measurement Framework?
Definition and Core Components
A brand measurement framework is the backbone of strategic brand management. It consists of layered KPIs and metrics that monitor how your brand performs in market perception, consumer engagement, and business impact. The framework typically includes dimensions such as brand awareness metrics, customer sentiment, purchase intent, and advocacy indicators.
These frameworks also incorporate supporting layers, such as demographic breakdowns, geographic trends, and channel-level performance. Each component helps marketers identify what resonates with their audience and where improvements are needed. For instance, brand health indicators can include emotional response analysis or category-specific familiarity indices. Unlike fragmented tracking systems, a well-built framework connects the dots between brand equity measurement and ROI, bringing clarity to performance conversations across teams. This is crucial for marketers overwhelmed by scattered analytics tools.
The ability to customize and adapt the framework to different industries and target audiences is also key. A SaaS company might focus heavily on NPS and product engagement, while a consumer goods brand could prioritize shelf presence and recall metrics. These nuances make the framework more than a one-size-fits-all checklist—it becomes a living, evolving tool.

Why It’s Crucial for Business Growth
Measuring a brand is not just about counting followers or impressions. Without a clear measurement structure, brands risk investing in tactics that don’t move the needle. A framework enables alignment between brand strategy services uae and business outcomes. For example, a digital-first startup can use brand tracking tools to monitor unaided brand recall, measure social engagement trends, and adjust content strategy in real time.
Without this alignment, marketing teams often struggle to justify budget allocations and demonstrate tangible value. This is especially true when brands invest in long-term initiatives like awareness campaigns or sponsorships, which may not yield immediate conversions but significantly influence brand perception. By incorporating these efforts into a comprehensive measurement system, marketers can provide evidence of ROI that resonates with stakeholders.
According to Forrester, brands with measurement maturity are 2.5x more likely to outperform revenue targets. This reinforces the value of embedding brand KPIs into strategic dashboards. Furthermore, organizations that standardize brand KPIs across departments see increased cross-functional alignment and improved operational efficiency. This not only strengthens the brand but also fosters a culture of accountability and data-driven decision-making.
Understanding Brand Performance KPIs
Awareness & Reach Metrics
At the top of the brand funnel sits awareness—perhaps the most vital stage for brands seeking growth. Awareness and reach metrics answer one simple question: Do consumers know your brand exists? But in practice, this simplicity hides complexity. Awareness isn’t a binary state; it spans familiarity, recognizability, and recall. That’s why a modern brand measurement framework begins by dissecting awareness into three core KPIs:
- Unaided Brand Recall: Measures spontaneous brand recollection. For example, when asked to name a running shoe brand, does the consumer say “Nike” without prompting?
- Aided Awareness: Assesses recognition when prompted. “Have you heard of Brooks Running?” Yes/no responses give clarity.
- Reach: Combines impressions, views, and audience size from ads, social posts, and organic exposure.
While reach quantifies visibility, awareness reflects memory and association. Marketers often conflate the two, leading to misleading dashboards. A Reddit marketer confessed: > “Our CMO celebrated 10 million impressions, but brand lift studies showed no one remembered our name.” This disconnect underscores why robust awareness KPIs must include recall testing—not just view counts.
Consideration, Preference & Engagement
Once consumers become aware, the next challenge is earning their consideration and preference—an area often called the “messy middle” of the funnel. Unlike awareness, which can be tracked via large-scale surveys, these metrics require behavioral and psychographic signals:
- Engagement Rate: Click-throughs, scroll depth, time-on-site
- Sentiment Analysis: Is the buzz around your brand positive, neutral, or negative?
- Share of Search: What percentage of branded search queries does your brand command?
- Social Proof: Follows, mentions, user-generated content
These KPIs are indispensable for gauging emotional resonance. Preference emerges when users interact beyond passive viewing—saving a post, sharing an article, comparing your product. Tools like Google Trends, Sprout Social, and Hootsuite Insights give marketers real-time snapshots of these behaviors. More advanced stacks use heatmaps and user journey tracking to understand content preference.
In B2B, preference can be seen in event participation, webinar signups, or asset downloads. In B2C, it’s basket additions, wishlists, and review sentiment. The key is consistent labeling of these signals across departments. A unified brand measurement model should treat all engagement signals as middle-funnel intent proxies.

Conversion & Advocacy Indicators
Conversion metrics reveal if branding efforts are leading to tangible business outcomes. But conversion doesn’t end with a sale—it extends into post-purchase advocacy, where true brand equity lies. This section dives into the most overlooked yet powerful KPIs:
- Net Promoter Score (NPS): “How likely are you to recommend our brand?”—a single question that links loyalty to growth.
- Referral Rate: % of customers acquired via peer recommendations
- Churn Rate & Retention: Especially valuable for subscription brands
- Customer Lifetime Value (CLTV): Measures long-term impact of branding
In high-involvement purchases—insurance, real estate, SaaS—conversion journeys are long and complex. Multi-touch attribution becomes crucial. Tools like HubSpot and Segment offer lead scoring based on branding interaction before sales conversion. If a user reads three branded blog posts, attends a webinar, and downloads a pricing sheet before signing up, that’s a signal of high brand influence.
For e-commerce, measuring post-purchase reviews and return rates offers insight into how well the brand experience matched expectations. Remember, a strong brand doesn’t just convert—it cultivates loyalty. Bain & Company research confirms that a 5% increase in retention yields 25–95% more profit.
KPI for brand performance isn’t a singular metric—it’s a layered view across awareness, engagement, conversion, and loyalty. This holistic tracking is what distinguishes data-driven brands from competitors that chase clicks without building lasting brand equity.
Models Behind Effective Brand Measurement
From Consumer Funnels to Brand Pyramid
Understanding how consumers move from awareness to loyalty requires more than tracking clicks or impressions. It demands a conceptual framework—a mental model—that connects psychological stages with behavioral signals. Historically, the AIDA model (Attention–Interest–Desire–Action) served as the go-to structure. But today’s brand ecosystems require more sophistication.
Enter Keller’s Brand Equity Pyramid, a model that captures the emotional and cognitive architecture behind brand loyalty. It builds in four stages:
- Brand Identity (Who are you?): Measured by brand recall and recognition
- Brand Meaning (What are you?): Assessed through brand associations and perceived quality
- Brand Response (What about you?): Captured by consumer judgments and feelings
- Brand Resonance (What about you and me?): Loyalty, advocacy, and emotional attachment
Incorporating this model into your brand measurement framework transforms a scatterplot of metrics into a strategic narrative. Each layer links with specific KPIs—brand recognition with awareness metrics, response with NPS and sentiment, and resonance with referral rate and repeat purchase behavior.
Competitive brands often adapt this pyramid for digital ecosystems. For example, a streaming platform used the model to map user actions across the funnel: trailer views (identity), watchlists (meaning), subscription starts (response), and social shares or binge patterns (resonance). By tying each brand interaction to the pyramid, they built an evidence-based brand roadmap.
Multi-Touch Attribution & Brand Impact
As customer journeys become non-linear, the idea that one ad or one post drives conversion has collapsed. That’s where multi-touch attribution (MTA) comes in—a methodology that evaluates the contribution of each brand interaction across channels. This model answers questions like:
- Did that YouTube ad assist the sale, or did the webinar seal the deal?
- Is Instagram engagement driving real site traffic or just vanity metrics?
- Are our awareness campaigns nudging leads or just burning budget?
MTA models vary. Linear attribution assigns equal value to each touchpoint. Time-decay models weight recent interactions more heavily. U-shaped models emphasize the first and last interaction. The choice depends on your sales cycle, industry, and channel mix.
According to Nielsen, brands using advanced attribution models see a 15–30% improvement in media ROI. One fashion retailer discovered their mid-funnel influencer collaborations were outperforming paid social campaigns in assisted conversions—insights that prompted a 40% reallocation of spend.
Yet challenges remain. Clean data, CRM integrations, and tracking user identity across platforms require technical rigor. Despite the hurdles, MTA is essential for brands that don’t want to under-report branding’s role in revenue.
Unified Expert‑Reviewed Framework
With dozens of models available—from the BrandZ model to BAV (Brand Asset Valuator)—marketers often suffer from framework fatigue. Each offers unique insights but applying them simultaneously leads to chaos. That’s why this article proposes a unified brand measurement model—a modular system that integrates the best aspects of expert models into a single decision-making dashboard.
This consolidated framework has three core zones:
- Foundation: Awareness, recall, and identity (inspired by Keller and BAV)
- Engagement & Consideration: Emotional response, content interaction, and share-of-search (from BrandZ and McKinsey’s journey models)
- Performance & Loyalty: NPS, LTV, and CLV (rooted in Bain’s loyalty frameworks)
Each metric is tagged by funnel stage, measurement frequency (monthly, quarterly), and source system (CRM, analytics, surveys). This layered approach ensures the framework is not only comprehensive but also implementable across teams.
An example rollout: A SaaS brand integrates Google Analytics for awareness metrics, Intercom for engagement data, and SurveyMonkey for loyalty signals. All flow into a Looker dashboard updated weekly. Over time, the brand identifies high-impact metrics (e.g., webinar engagement → NPS boost) and reduces dashboard clutter by 40%.
This is the power of synthesis—not just collecting metrics, but creating a living measurement ecosystem that adapts to both brand evolution and market shifts.
Developing Your Brand Measurement Dashboard
Choosing Tools & Data Sources
A brand measurement framework is only as effective as the tools and data sources it draws from. Without centralized, reliable data, even the most well-designed KPIs lose their power. The first step to developing a strong dashboard is selecting the right tools—ones that align with your brand maturity, tech stack, and strategic goals.
Foundational Tools:
- Google Analytics 4 (GA4): For site behavior, engagement metrics, and traffic sources
- Brandwatch or Sprinklr: For real-time social listening and sentiment analysis
- Survey platforms (e.g., Qualtrics, Typeform): To measure NPS and brand perception
- CRM tools (e.g., HubSpot, Salesforce): For tracking conversion and customer lifetime value
Advanced Tools:
- Looker, Tableau, or Power BI: For creating custom dashboards with API integrations
- Segment or Snowflake: For unifying customer data from multiple sources
- Hotjar or Crazy Egg: For visual behavior tracking like click maps and scroll analysis
When constructing the dashboard, ensure that each KPI is mapped to a clear data source and updated at an appropriate frequency (daily, weekly, monthly). Avoid overloading the dashboard with 50+ metrics—start with 10–15 critical indicators and build as needed. Remember, the goal is to generate insights, not just reports.
Pain Point Tip: Many brand teams struggle with integrations. One practical fix is starting with Google Data Studio to link GA4, YouTube, and Search Console data. From there, layering in qualitative tools (like review analysis) helps build a 360° brand view.
Setting Benchmarks and Targets
Data without benchmarks is meaningless. You may know your NPS is 42 or that your share of voice on Twitter is 12%, but without context, those numbers are just noise. That’s why the next step in dashboard development is goal-setting—turning data into targets.
Start With Internal Baselines:
Track historical data over 3–6 months. If brand recall averaged 25% in Q1, that becomes your baseline.
Add Competitive Comparisons:
Use tools like SEMrush, Brandwatch, or Gartner peer benchmarks. If the top three competitors have an average NPS of 55 and your brand sits at 42, the gap reveals opportunity.
Build Tiered Targets:
For example:
- Red Zone: Under 20% recall → immediate action
- Yellow Zone: 20–30% → monitor weekly
- Green Zone: 31–40% → optimize further
Expert Tip: Mark Ritson notes, “You can’t manage what you don’t measure—and you can’t measure what you haven’t defined.” Defining what “good” looks like is essential to get organizational buy-in.
Use the Brand Strategy and execution philosophy here—connect benchmarks to brand priorities. For instance, if brand trust is a key strategic theme, set quarterly NPS targets and link them to PR, content, and customer service objectives. This drives accountability beyond the marketing team.
Automating Reporting & Insights
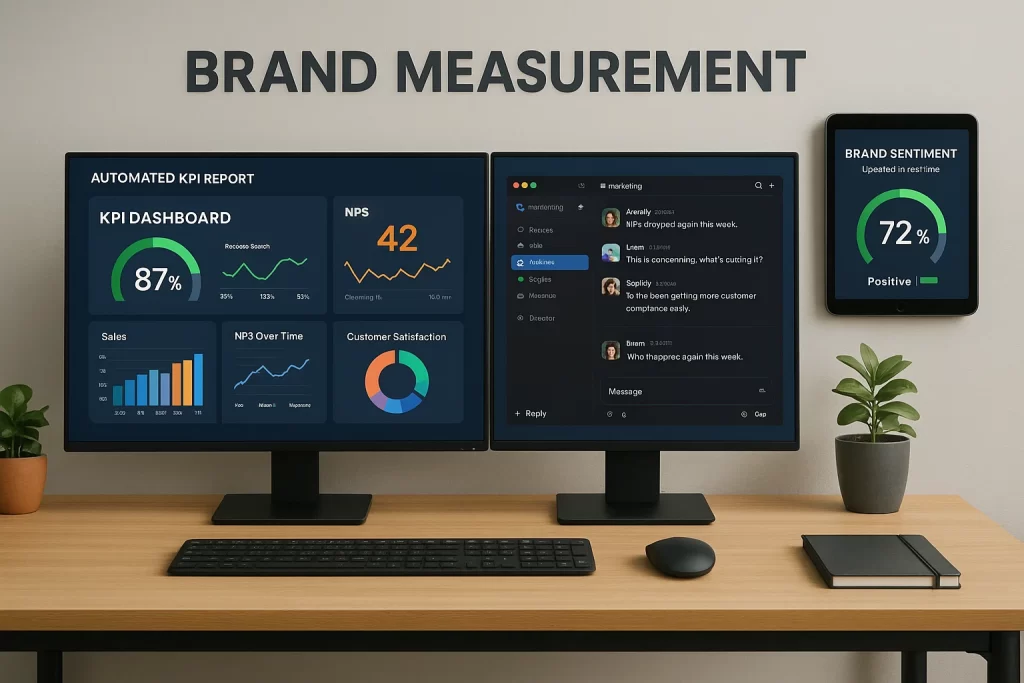
Real-time decision-making demands real-time data. Yet many marketing teams are stuck in reporting cycles that take days to compile and deliver. Automation solves this by making dashboards not just visible—but operational.
What to Automate:
- Weekly Email Reports : Highlight top brand KPIs, anomalies, and trends
- Slack Alerts or MS Teams Bots : Triggered by sentiment dips, NPS changes, or viral mentions
- KPI Scorecards : Auto-updated dashboards for leadership teams with color-coded performance indicators
Use tools like Zapier, Supermetrics, or native connectors (Looker to Gmail, HubSpot to Slack) to create these workflows. The result? A brand command center that speaks across time zones and departments.
Additionally, implement storytelling elements. Rather than sending static bar graphs, annotate trends:
“Brand engagement surged 17% this week due to the #NewLaunch campaign. NPS improved by 8 pts among Gen Z audiences.”
This builds data literacy within non-marketing teams and turns passive viewers into data champions.
Common Pitfall: Over-automation. If every mention triggers an alert, teams suffer from data fatigue. Set smart thresholds to only highlight significant movement (e.g., sentiment shifts of >10%, or a 2-week decline in recall).
Real‑World Example: Brand Metrics in Action
Example of a Measurement Framework at Work
To illustrate how a brand measurement framework functions in a real-world setting, let’s examine the case of a fictional mid-sized SaaS company called “CloudNova.” Specializing in workflow automation, CloudNova struggled to connect its rising ad spend to meaningful business outcomes. They had traffic, clicks, and conversions—but no consistent way to understand brand sentiment, preference, or loyalty.
Here’s how they built a tiered framework that connected branding to the bottom line:
Foundation: Awareness & Reach
They began by tracking unaided and aided recall using monthly survey panels. Tools like Google Surveys and Typeform collected feedback on whether respondents recognized the brand unaided and whether they’d seen their digital ads. Baseline unaided recall was just 7%.
Engagement: Consideration & Preference
CloudNova integrated Hotjar and GA4 to understand content engagement. They found that visitors who read the “Customer Success Stories” section had a 38% higher likelihood of requesting a demo. They labeled this a “content preference signal” and began optimizing the layout and CTAs.
Performance: Conversion & Advocacy
They implemented Net Promoter Score (NPS) across onboarding emails and support tickets. Their first measurement came in at a neutral 35. After segmenting NPS by feature usage, they discovered that users who adopted the automation toolkit within the first 14 days had an average NPS of 61. This became a leading indicator of satisfaction.
Within six months of implementing their new dashboard:
- Unaided recall rose from 7% to 21%
- NPS increased from 35 to 49
- Referral traffic grew by 31%
- Customer acquisition cost decreased by 18%
These improvements weren’t accidental. CloudNova had built a feedback system grounded in consistent tracking, benchmarked KPIs, and tight alignment across marketing, product, and support teams.
This case directly responds to long-tail queries like What is an example of a measurement framework? and brand metrics examples. More importantly, it showcases how clarity in measurement drives clarity in decision-making.
Lessons Learned & Pitfalls to Avoid
Every framework rollout comes with its own set of lessons—and CloudNova was no exception. Let’s explore some common pitfalls and strategies to sidestep them:
1. Tracking Too Many Metrics
Initially, the team tracked over 40 KPIs—causing confusion and reporting fatigue. They later streamlined to 12 critical metrics based on funnel stages.
2. Misaligned Metrics
They noticed a disconnect between customer satisfaction scores and churn. Why? The metrics were being captured at different lifecycle points. By re-aligning NPS with product milestones (e.g., 30-day activation), they ensured consistency.
3. Ignoring Qualitative Feedback
Initial dashboards lacked open-text analysis. When they began categorizing user feedback, patterns around trust and onboarding friction emerged—leading to both UX improvements and updated messaging.
4. Failing to Revisit Benchmarks
Their initial goals were set and forgotten. A quarterly KPI review loop now ensures that goals stay ambitious but realistic, with constant recalibration.
The biggest takeaway? Dashboards aren’t just reporting tools—they’re strategic instruments. A good framework evolves with the brand. It surfaces weak spots early and celebrates wins with data-backed credibility.
Ensuring Continuous Improvement
Monitoring and Iterating on Your Framework
Brand performance isn’t static—it evolves with shifting markets, emerging technologies, and changing consumer expectations. That’s why the most successful organizations treat their brand measurement framework as a living system rather than a fixed blueprint. Continuous monitoring and agile iteration are essential.
Monthly Reviews: Track surface-level KPIs such as engagement rate, traffic sources, and unaided brand recall. These metrics fluctuate frequently and can reveal short-term campaign effects.
Quarterly Deep Dives : Analyze sentiment trends, funnel conversion ratios, and NPS movements. Map brand performance against quarterly objectives (e.g., “increase awareness among Gen Z”) to assess strategic alignment.
Annual Framework Audits : Rethink metric relevance, data accuracy, and reporting frequency. Re-align framework structure with new business priorities, especially after major product launches, rebrands, or market entries.
Use agile tools like Trello, Notion, or Monday.com to document metric hypotheses, outcomes, and refinements. Create a “Brand KPI Backlog” for metrics you want to test or evolve over time—this helps drive experimentation and avoid data inertia.
Aligning with Business Outcomes
The true north of any branding effort is not just perception—but performance. Unfortunately, many brand dashboards stop at intermediate metrics—sentiment, reach, clicks—and fail to connect to bottom-line results. Bridging this gap requires conscious alignment between brand KPIs and business outcomes.
Practical Examples:
- Unaided Brand Recall → Organic Search Volume → Site Conversions
- NPS Improvement → Customer Retention → Revenue Per User
- Brand Trust Lift → Increased Pricing Power → Margin Expansion
Start with the end in mind: if Q4 objectives include expanding into the SMB market, then set awareness, sentiment, and conversion KPIs specific to that segment. Use cohort-based dashboards to isolate performance and ensure you’re not masking insights under global averages.
Brands like Airbnb have developed brand-health-to-revenue link models that estimate the dollar value of every brand equity point. That’s the future of measurement—where brand building is seen as a high-ROI function rather than a cost center.
Stakeholder Buy-In & Governance
Without stakeholder support, even the best frameworks risk falling into disuse. The key to longevity is embedding brand measurement into the organization’s culture and rhythm. This requires governance.
Assign Metric Ownership : Define who owns what—NPS might be with Customer Success, share-of-voice with PR, and engagement with Digital. Ownership ensures accountability and consistency.
Institutionalize Reporting Cadence:
- Weekly: Tactical highlights for marketing teams
- Monthly: Cross-functional insights for marketing, product, and CX
- Quarterly: Strategic narratives for the executive team
Visualize the Framework: Use branded, interactive dashboards (e.g., via Looker Studio or Tableau) to make metrics accessible and engaging. Visual clarity leads to better data adoption.
Train for Data Literacy: Host quarterly “Brand Metrics Masterclasses” internally. Equip teams to read, interpret, and act on dashboards—not just passively observe.
Above all, create a shared language. When everyone from the CMO to the support rep understands what NPS means, why sentiment matters, or how brand equity ties to business growth, you’ve won half the battle.
FAQ
1. What is an example of a measurement framework for branding?
A robust example integrates funnel-based KPIs—like unaided recall, engagement rate, and NPS—with sentiment tools and CRM data. For instance, a brand might use Google Surveys to track awareness, GA4 for site engagement, and HubSpot for conversion and retention insights. These metrics are visualized in a single dashboard, updated weekly, and reviewed quarterly.
2. How do I pick the right brand KPIs for my business?
Begin with your core goals: Are you aiming to grow awareness, improve reputation, or drive referrals? Then map KPIs to each stage. If trust is key, focus on sentiment analysis and Net Promoter Score. For awareness, use share-of-search or unaided recall. Remember—choose KPIs that influence real outcomes, not vanity metrics.
3. How often should I review my brand metrics?
Tactical indicators like engagement rate or impressions should be reviewed weekly. Strategic metrics like NPS or unaided recall are better suited for monthly or quarterly review. Align cadence to business rhythms. During a product launch, increase monitoring; during brand maintenance, space it out.
4. What if my brand data contradicts business performance?
This is more common than you think. A Reddit user wrote:
“Our traffic was down, but our survey said we were more trusted than ever. It was hard to explain at the board meeting.”
That’s a case of lag metrics—brand health often impacts performance with a delay. Always clarify time windows and triangulate brand metrics with transactional data to explain such gaps.
5. Can small businesses use brand measurement frameworks too?
Absolutely. Start small: use 3–5 KPIs. Google Trends for awareness, Typeform for surveys, and email click rates for engagement. As you grow, add layers—just ensure clarity doesn’t get lost in complexity.
Conclusion
In today’s fragmented, hyper-competitive landscape, brands can no longer afford to operate without measurement. A well-designed brand measurement framework is more than a reporting tool—it’s a strategic asset. It connects marketing to outcomes, perception to profit, and engagement to loyalty.
By integrating KPIs like brand awareness, NPS, sentiment analysis, and CLTV, and grounding them in expert-backed models like Keller’s Pyramid and multi-touch attribution, organizations gain both clarity and control. They stop reacting and start optimizing. They stop guessing and start growing.
More importantly, they align their teams—from product to customer success to the C-suite—under a shared narrative of what the brand stands for and how it’s performing.
The journey to build this framework isn’t instantaneous. It requires technical setup, stakeholder alignment, and cultural change. But as proven by case studies, expert consensus, and Reddit war stories alike—it’s a journey worth taking.