Building a Brand Performance Metrics Dashboard: Tracking Success in Real-Time
Introduction
Brand performance has evolved from a fuzzy concept into a quantifiable business function—one driven by real-time data, strategic metrics, and visual reporting. In today’s competitive landscape, organizations can no longer afford to guess how their brands are performing. They need precision, agility, and above all, alignment between brand strategy and execution.
According to McKinsey, companies that consistently track brand drivers such as awareness, consideration, and loyalty outperform peers by up to 30% in revenue growth. Yet, most organizations still struggle to connect their brand goals with performance outcomes. Why? Because there’s often a gap between strategy and action.
This is where a Brand Performance Metrics Dashboard becomes transformative.
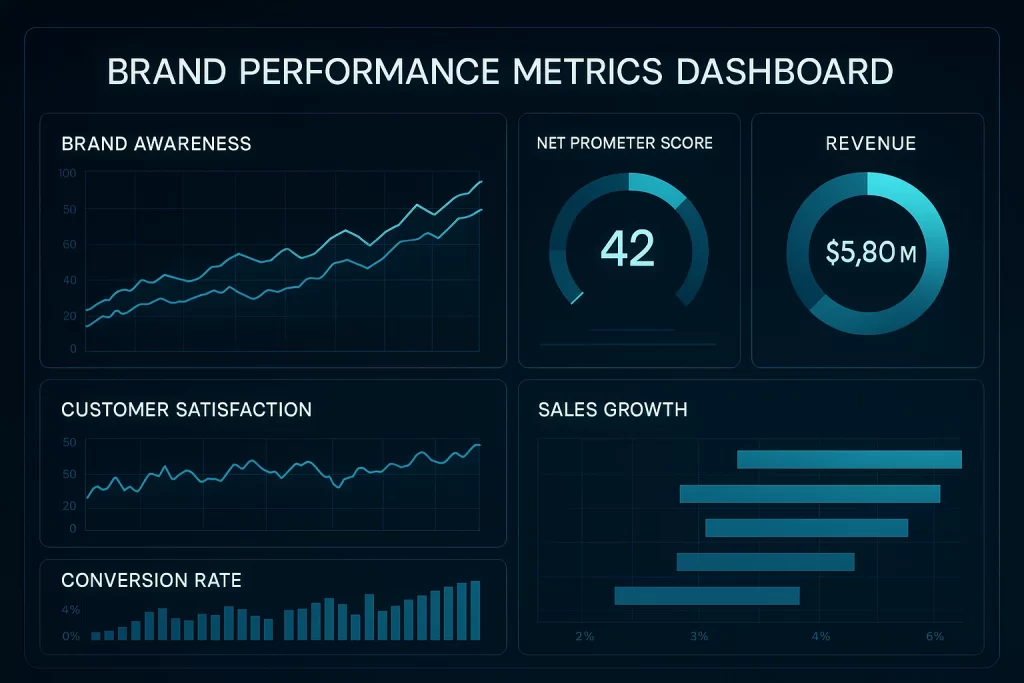
It provides a centralized, data-rich interface that turns strategic objectives into measurable KPIs—bridging the critical gap between brand planning and brand results. Think of it not as a reporting tool, but as the heartbeat of your brand health—tracking signals across awareness, engagement, equity, and sentiment.
The ability to track real-time performance is not just an analytics advantage; it’s a strategic imperative. Dashboards empower CMOs, brand managers, and marketing leaders to align brand strategy and execution by delivering live insights into what’s working—and what’s not.
By the end of this article, you’ll have a complete framework to build a strategic, data-backed dashboard that tells the story of your brand—clearly, continuously, and convincingly.
Core Metrics Every Brand Dashboard Should Include
A Brand Performance Metrics Dashboard is only as strong as the KPIs it tracks. Without carefully chosen indicators, your dashboard risks becoming a collage of vanity metrics. The right metrics transform the dashboard into a strategic command center, highlighting what truly drives brand equity, consumer perception, and market momentum.
This section focuses on strategic KPI selection—not just what to track, but why each metric matters.
A. Brand Awareness Metrics
These reveal how many people know your brand exists.
- Impressions & Reach: Measures exposure—how often your brand is seen.
- Search Volume: Are more people Googling your brand or products?
- Social Share of Voice: Your brand’s visibility relative to competitors on social platforms.
B. Brand Engagement Metrics
Engagement reflects interest and interaction—crucial for mid-funnel insights.
- Click-Through Rates (CTR) on brand content
- Social Engagement (likes, shares, comments)
- Email Open & Click Rates
“Engagement signals intent. Tracking it allows brands to preempt behavior shifts.” — Forrester Research
C. Brand Consideration & Preference
These indicators show if your audience is moving from awareness to purchase intent.
- Website Bounce Rate & Time on Site
- Brand Preference Studies
- Direct Traffic Growth (signals brand recall)
D. Brand Sentiment & Reputation Metrics
Sentiment tells you not just how often you’re mentioned—but how people feel about you.
- Net Promoter Score (NPS)
- Social Sentiment Analysis
- Customer Reviews (aggregate ratings)
“We had no clue people hated our customer support until sentiment tracking flagged a 40% dip in positive mentions. Changed everything.”
E. Brand Loyalty & Retention Metrics
Loyalty drives long-term brand strength.
- Repeat Purchase Rate
- Customer Lifetime Value (CLTV)
- Subscription Renewals or Churn Rate
F. Financial & Market Metrics
These show brand impact on revenue and market share—essential for the C-suite.
- Branded Revenue Share
- Market Penetration
- Cost per Acquisition (CPA) for branded campaigns
G. Custom KPIs (for Startups and Niche Brands)
Smaller brands or niche categories may require tailored KPIs:
- Influencer Activation Impact
- Community Growth Metrics
- Brand Advocacy Rate
Solving Key Challenges: “We’re small. Are these enterprise metrics even relevant to us?”
Incorporating Competitor Benchmarks
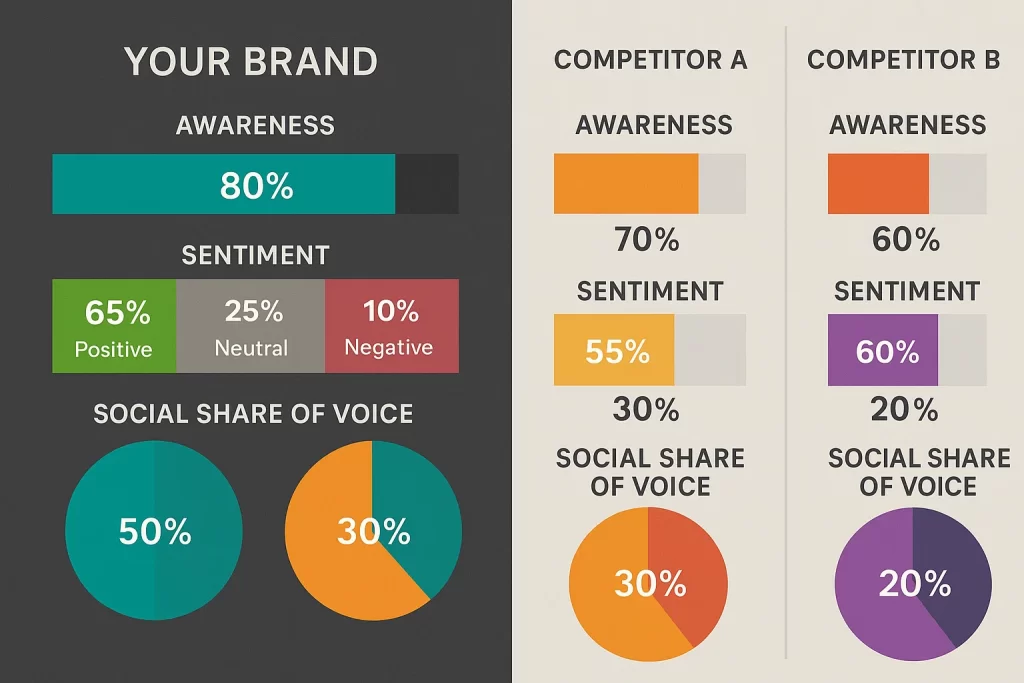
A Brand Performance Metrics Dashboard without context is like a GPS without a map—it shows movement, but not direction. That’s why competitor benchmarks are critical. They bring meaning to your KPIs by helping you understand whether your performance is exceptional, average, or underwhelming.
Imagine your brand awareness score has increased by 12% over the past quarter. Great, right? But what if your competitors improved by 30% in the same time frame? Suddenly, that 12% feels less impressive—and more urgent. This is the value of benchmarking: it helps brands stay grounded, realistic, and competitive.
Why Benchmarking Matters
Benchmarks add external validity to your internal data. They provide:
- Strategic perspective: Are you keeping pace with market growth or falling behind?
- Industry standards: What KPIs are considered healthy in your category?
- Competitive alerts: Is a rival brand suddenly surging in sentiment or engagement?
“Benchmarking allows brand dashboards to act not only as mirrors, but as windows into competitive dynamics.” — Forrester Insights
Solving Key Challenges: “We’re tracking performance, but we don’t know if we’re winning or just busy.”
What to Benchmark
1. Brand Awareness Benchmarks
Compare search volume trends, impression share, and media mentions with direct competitors.
2. Social Share of Voice
Measure how your brand mentions stack up against others in your industry.
3. Sentiment Comparison
Track net sentiment across brands. Tools like Brandwatch or Sprout Social can provide this at scale.
4. Engagement Metrics
CTR, time on page, bounce rate—see where your brand sits vs. market averages.
5. Customer Satisfaction
Compare NPS benchmarks from industry reports like Forrester, Gartner, or Statista.
Where to Source Benchmark Data
- Statista – Industry-specific KPI averages
- Forrester Research – Competitive digital benchmarks
- Social Media Listening Tools – Like Brand24, Talkwalker, Meltwater
- SEO Platforms – Ahrefs, SEMrush offer branded search volume insights
- Public Reports – Use annual reports of public competitors
How to Visualize It
Make comparisons digestible with:
- Bar Charts for direct KPI comparisons
- Line Graphs for trend over time
- Heatmaps for channel-by-channel performance
Real-Time Tracking & Dashboard Design
A static dashboard is like a rearview mirror—it shows where you’ve been, not where you’re going. In contrast, real-time dashboards act as the eyes on the road ahead. For modern brand teams, real-time performance visibility is no longer a luxury—it’s the foundation of agility, responsiveness, and strategic execution.
The Value of Real-Time Data in Brand Performance
Real-time tracking allows brands to:
- Spot emerging sentiment trends before they become crises
- React swiftly to underperforming campaigns or plummeting engagement
- Showcase brand KPI wins to stakeholders while momentum is still fresh
According to a report by Salesforce, 62% of high-performing marketing teams leverage real-time dashboards to monitor and optimize brand campaigns in progress
“Real-time brand tracking helped us catch a drop in trust after a pricing change—before our quarterly review even happened.” — CMO, DTC apparel brand
Solving Key Challenges: “We run weekly campaigns but only get monthly reports. We’re always behind.”
Choosing the Right Platform
When selecting a dashboard tool, look for:
- Real-time data syncs (via APIs or direct integrations)
- Custom KPI configuration
- Cross-channel inputs (web, social, paid, CRM, etc.)
- User access control for team-specific views
Top Tools to Consider
- Google Looker Studio: Ideal for flexibility and data blending
- Tableau: Enterprise-level depth and interactivity
- Domo / Klipfolio: Mid-size brands with real-time needs
- Power BI: Seamless Microsoft stack integration
Design Principles for Effective Brand Dashboards
An effective dashboard isn’t just functional—it’s narrative-driven. It should tell a story at a glance.
Best Practices
- Start with Strategic KPIs – Don’t overload it; prioritize 6–10 key metrics.
- Use Visual Hierarchy – Bold important numbers, minimize noise.
- Highlight Delta & Trend – Show current performance + % change vs. last period.
- Segment Views – By channel, campaign, or geography.
- Embed Brand Goals – Add a fixed panel for brand objectives or OKRs.
The Role of Interactivity
Interactive dashboards allow users to:
- Filter by campaign, region, or time
- Click into metrics for context
- Customize views for team-specific needs
This interactivity improves engagement, stakeholder buy-in, and diagnostic power—turning dashboards into strategic tools, not just scoreboards.
Data Framework & Integration Strategy
Every great Brand Performance Metrics Dashboard stands on a silent foundation: a robust data framework. Without it, even the most elegant dashboards will display delayed, disconnected, or downright misleading metrics.
This section is all about building a reliable data infrastructure—a system that integrates multiple sources into a single, real-time view that accurately reflects your brand’s performance.
The Data Challenge
Most brand teams deal with fragmented systems:
- Social metrics in one tool
- Web traffic in another
- CRM in a third
- Surveys in spreadsheets
- And brand health in quarterly PDFs
This fragmented setup leads to manual work, stale data, and low trust in brand reports.
“We used to spend 40% of our time aggregating data instead of analyzing it. Now, with real-time data integration, our dashboard does the heavy lifting.” — VP Marketing, SaaS Startup
Solving Key Challenges: “Our brand data lives in silos. We can’t see the big picture.”
Step-by-Step: Building a Data Framework for Brand Dashboards
1. Identify Data Sources
Start by mapping out all brand-related data:
- Social media (e.g., Meta Insights, LinkedIn, TikTok)
- Search & SEO (Google Analytics, Ahrefs)
- Web traffic (Google Analytics, Hotjar)
- CRM / Email (HubSpot, Salesforce, Klaviyo)
- Brand sentiment (social listening tools like Brandwatch)
- Survey & review platforms (Trustpilot, Google Reviews, SurveyMonkey)
2. Establish a Data Pipeline
Use connectors or APIs to streamline data collection into a centralized hub (ETL approach: Extract, Transform, Load).
- Extract: Pull from APIs, exports, or scraping
- Transform: Standardize formats, clean duplicates
- Load: Feed into a warehouse or BI tool (e.g., BigQuery, Snowflake)
3. Define KPI Logic
Ensure every KPI is well-defined and universally understood:
- What data feeds it?
- What’s the refresh rate?
- Is it absolute, comparative, or indexed?
Example: “Brand Consideration Score = (Direct Traffic + Branded Search Visits) / Total Visits — refreshed daily.”
Tool Stack Recommendations
- Data Integration: Supermetrics, Funnel.io, Stitch
- Warehouse: BigQuery, Snowflake
- Transformation Layer: dbt, Apache Airflow
- BI/Dashboard Layer: Looker Studio, Tableau, Power BI
Best Practices
- Automate everything: Avoid manual exports
- Monitor data health: Build alerts for missing feeds or irregular spikes
- Maintain naming conventions: Especially across teams
- Centralize definitions: Build a KPI glossary embedded in the dashboard
Why This Matters
Without a strong data foundation, your dashboard will constantly be in question—“Where did this number come from?” A transparent, integrated framework builds trust, clarity, and speed, all essential to making your dashboard an executive tool, not just a marketing toy.
Presenting the Dashboard to Stakeholders
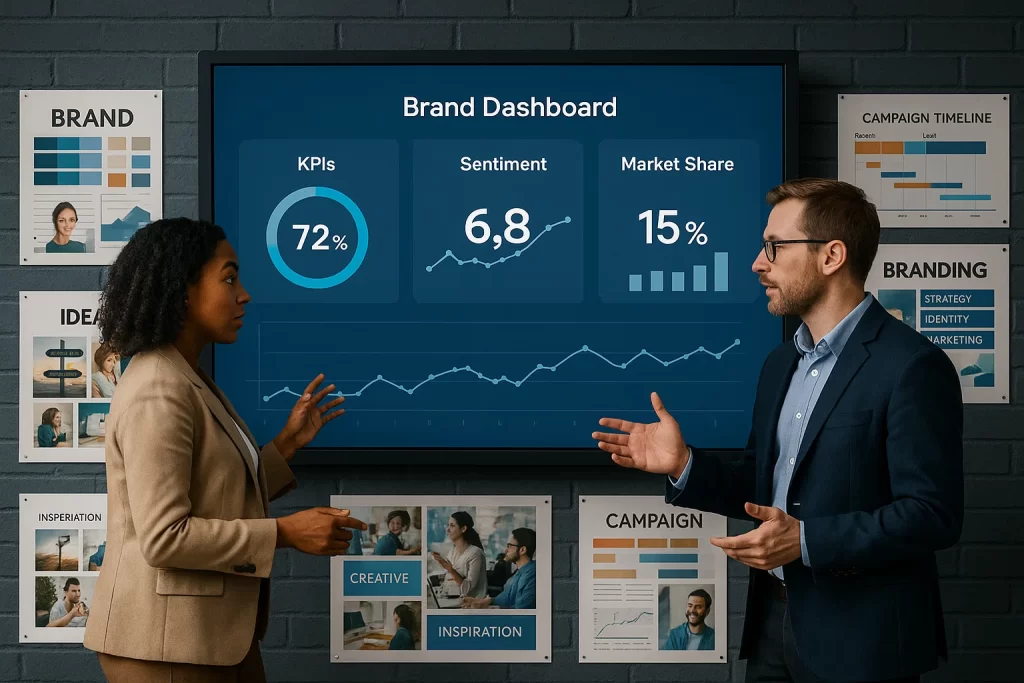
Even the most powerful Brand Performance Metrics Dashboard will fail if stakeholders can’t understand—or trust—what they’re looking at. Presenting the dashboard effectively is about translating metrics into meaning and data into decisions.
Dashboards must serve different audiences:
- CMOs need topline performance trends
- Brand managers want campaign-specific insights
- Product or sales teams seek customer sentiment signals
- Executives demand concise, outcome-oriented visuals
Your job isn’t just to show data—it’s to tell a performance story that aligns with business strategy.
Tailoring Dashboard Views by Stakeholder Type
A. Executive / C-Level
Focus: Outcomes & Trends
- KPI Scorecards (e.g., Awareness, Sentiment, NPS)
- Quarter-over-Quarter Growth
- ROI on Brand Campaigns
- Key Benchmarks vs. Industry
Format: Clean, minimalist dashboards with big numbers, trending arrows, and goal comparisons.
B. Brand & Marketing Teams
Focus: Channel + Tactical Performance
- Social engagement by platform
- Sentiment trend lines
- Ad performance KPIs
- Branded search traffic
Format: Interactive dashboards with filters by date, campaign, region.
C. Product / Sales Teams
Focus: Brand perception, NPS, retention metrics
- Customer sentiment
- Trust indicators (reviews, testimonials)
- Brand preference scores
Format: Charts with customer quotes, review heatmaps, loyalty scores.
Addressing the Fear Factor
“The board wants numbers, not charts.”
“I’m afraid stakeholders will misinterpret the data.”
These fears are real. Reduce risk by:
- Including a Data Glossary slide
- Sharing interpretation frameworks (e.g., “A sentiment score below 60% = alert zone”)
- Conducting walkthroughs for first-time viewers
“We realized no one was using our dashboard because execs didn’t know what the metrics meant. Once we added definitions and color cues, engagement doubled.”
Maintaining & Evolving Your Dashboard
Dashboards are not one-time builds—they’re living systems. As your brand evolves, campaigns launch and markets shift, your Brand Performance Metrics Dashboard must keep pace. Otherwise, what once was insightful becomes outdated or misleading.
A high-functioning dashboard is never static. It adapts to new business goals, incorporates fresh KPIs, and discards what’s no longer useful.
Why Maintenance is Critical
- KPIs that once mattered may lose relevance as strategies shift
- Benchmarks can become outdated in fast-changing industries
- New data sources emerge, making older metrics incomplete
- Stakeholders begin to tune out dashboards that don’t evolve
Solving Key Challenges : “Our dashboard made sense last year, but now it doesn’t reflect our brand goals.”
“You can’t expect stakeholders to trust a dashboard that never changes. Static data = static thinking.” — CMO, fintech brand
Core Maintenance Activities
1. Quarterly KPI Audit
- Revisit brand goals and ensure dashboard metrics reflect them
- Remove obsolete or duplicative KPIs
- Add newly relevant metrics (e.g., TikTok engagement or sustainability sentiment)
2. Benchmark Refresh
- Update competitor performance figures using tools like Statista or Gartner
- Re-align score thresholds with new market data
3. Tool Integration Checks
- Ensure API feeds (e.g., from social, CRM) are syncing correctly
- Replace deprecated metrics or platform changes (e.g., Meta API adjustments)
4. Stakeholder Feedback Loops
- Ask users: What metrics are unclear? What’s missing?
- Run internal surveys: “Which dashboard view do you use most?”
Evolve with Business Growth
Your dashboard should reflect the maturity stage of your brand:
- Startup? Focus on brand awareness, earned reach, and influencer ROI
- Growth stage? Shift toward engagement, brand preference, and CLTV
- Established brand? Emphasize loyalty, sentiment, and brand equity lift
Create a Dashboard Maintenance Schedule
| Frequency | Task |
| Weekly | Check data feed health |
| Monthly | Review trend anomalies |
| Quarterly | KPI audit + Benchmark update |
| Annually | Structural review (framework, tools, design) |
FAQ
1. How many metrics should I include on my brand dashboard?
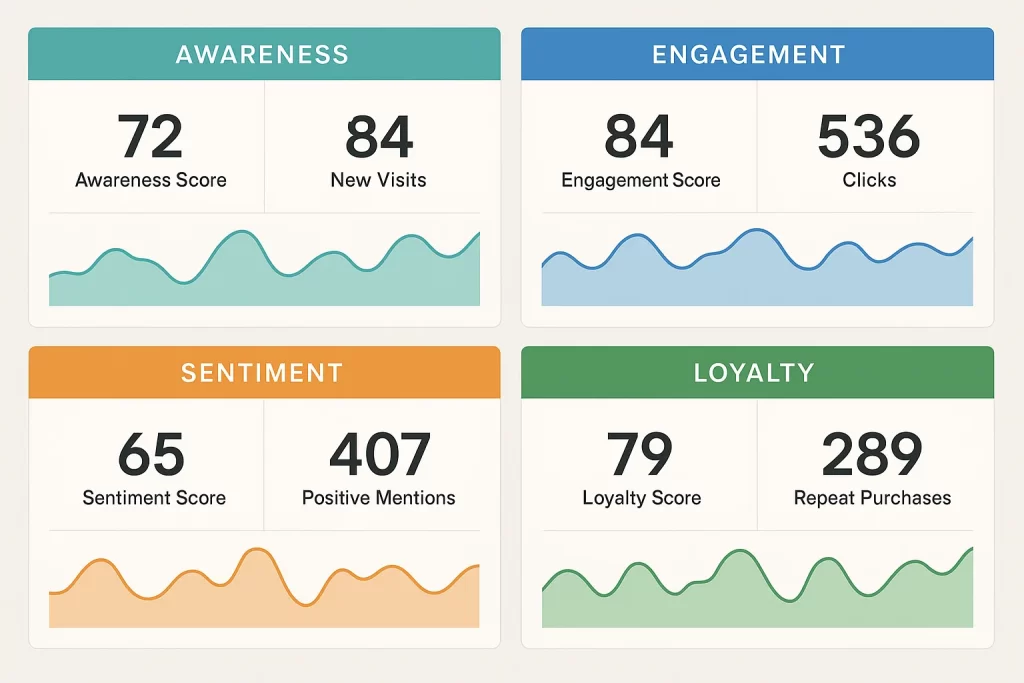
Less is more. Aim for 6–10 core KPIs. These should align with your current brand strategy and execution priorities. Avoid the temptation to track everything—focus only on what directly informs decisions.
Tip: Break dashboards into modules (e.g., Awareness, Engagement, Loyalty) to maintain clarity without overcrowding.
2. What’s the difference between brand awareness and brand consideration—and which should I prioritize first?
- Brand Awareness = “I’ve heard of this brand”
- Brand Consideration = “I’d consider buying from this brand”
You need both, but awareness comes first. That said, awareness without consideration is a vanity metric.
“We had amazing reach, but our conversion was terrible—turned out no one actually trusted the brand. We shifted to sentiment and consideration metrics and saw better alignment.”
3. How often should we update competitor benchmarks?
Ideally, quarterly. Some fast-changing industries (e.g., SaaS, DTC, fashion) may require monthly updates. Regular benchmark reviews ensure you’re not operating off stale data and allow you to adjust brand performance insights accordingly.
Use sources like:
- Statista
- Gartner
- Public competitor annual reports
4. Can a startup use the same brand performance metrics as a large enterprise?
Not exactly. Startups should focus on velocity and visibility, while enterprises can afford to track equity and loyalty. For example:
- Startup KPIs: Branded search growth, earned impressions, influencer-driven reach
- Enterprise KPIs: Brand equity lift, NPS by region, brand recall studies
5. What tools or platforms are best for real-time brand dashboard building?
Here are tools based on complexity level:
- Beginner: Google Looker Studio (free, flexible)
- Mid-Level: Domo, Klipfolio (interactive, API support)
- Enterprise: Tableau, Power BI, or custom-built dashboards using Snowflake + dbt + Looker
Make sure the platform supports:
- API integrations
- Mobile/responsive views
- Scheduled updates
- Stakeholder permissions
Conclusion
A well-crafted Brand Performance Metrics Dashboard is not just a collection of charts—it’s the strategic compass for your brand. From defining the right KPIs to integrating real-time data, benchmarking against competitors, and aligning every metric with business outcomes, a dashboard becomes the bridge between brand strategy and execution.
In a world where branding decisions must move at the speed of digital behavior, your dashboard must evolve from a passive report into an active decision-making system. It should clarify, simplify, and amplify the story your brand is telling—internally and externally.