Key Performance Indicators
DATA & BI ANALYTICS > Key Performance Indicators
Key Performance Indicators
Smart KPI frameworks and BI analytics in the UAE that turn raw data into strategic insight—helping you measure performance and make informed decisions faster.
KPI-Driven Intelligence
We build KPIs that connect data points across systems into a usable BI model.
Dashboards Built for Action
Visuals and summaries that make it easy to spot trends, risks, and priorities.
UAE-Focused Metrics
Custom KPI alignment to regional benchmarks, customer behavior, and industry goals.
Why Choose Us
Metrics That Move Business
We help UAE brands set and track Data & BI KPIs that connect performance with goals—delivering visibility, alignment, and growth-driving clarity.
“We finally have a data model that helps guide—not just report—our decisions.”
Yusuf Kamal
― Analytics Head

BI KPI Model Development
We define KPIs that integrate across your data stack—connecting CRM, ERP, and marketing platforms into one strategic business intelligence framework.
- End-to-end KPI maps
- Integrated data sources
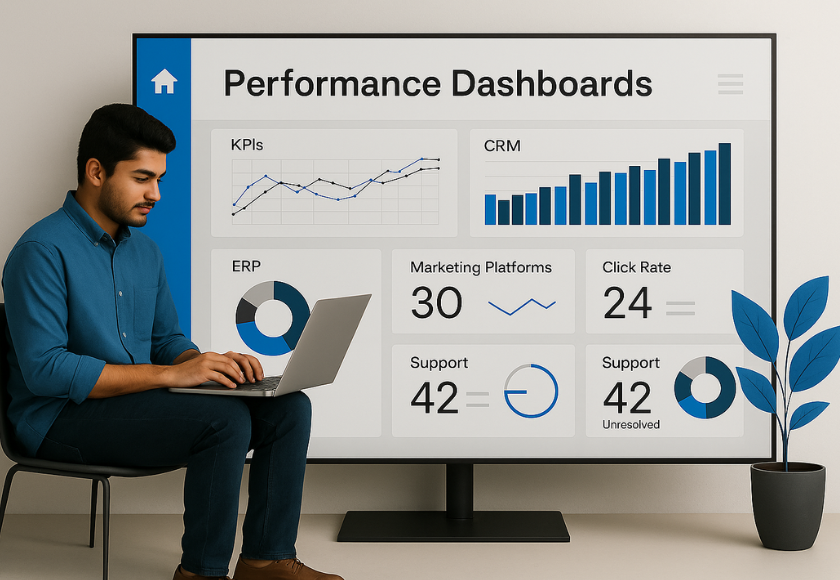
Real-Time Performance Dashboards
Custom-built dashboards that report your BI KPIs with real-time accuracy—giving leadership teams the clarity to act, scale, or correct fast.
- Visual, real-time views
- Action-driven insights
Our Services
Explore BI KPI Solutions UAE
From enterprise dashboards to lean startup metrics, our KPI solutions in the UAE empower data teams and leadership with strategic, cross-platform visibility.

KPI Mapping Workshops
Collaborative sessions to define key business questions and metrics that matter.

BI Dashboard Design
Visual dashboards that track KPI performance across operations and marketing.

Revenue KPIs
Tracking recurring revenue, average order value, and pipeline performance.

Marketing Attribution KPIs
Multi-touch attribution metrics that show what really drives conversions.
Customer Behavior KPIs
Lifetime value, churn rate, NPS, and user flow metrics that inform UX and retention.

Department-Level KPI Views
Custom dashboards for sales, marketing, operations, and executive leadership.
Key Performance Indicators
KPIs (Key Performance Indicators): Strategic Measurement for Brand Performance in the UAE
In today’s brand ecosystem, success isn’t just about what you do—it’s about what you measure. Key Performance Indicators (KPIs) are the metrics that define performance, direct resources, and drive decision-making. In the UAE’s high-velocity business environment, where marketing, visibility, and trust intersect, KPIs must go beyond vanity. At Octopus, we define, implement, and analyze KPIs that align with strategic objectives, local market expectations, and long-term brand ambition.
Why KPIs Matter for Modern Brands in the UAE
In the UAE, where growth is ambitious and timelines are compressed, brands are expected to deliver results with precision and clarity. CMOs, founders, and stakeholders want to know what’s working, what’s gaining traction, and what’s driving return. Whether you’re launching a new identity, scaling thought leadership, or building visibility, KPIs provide the structure to track and improve performance.
The right KPIs help cut through noise. They align creative expression with business strategy. They provide benchmarks to validate campaign value, inform brand pivots, and justify resource allocation. In sectors ranging from real estate and fintech to retail and healthcare, KPIs are how leadership evaluates relevance, impact, and growth.
Moreover, in the multicultural and fast-scaling context of the UAE, KPIs provide a unified language for cross-functional alignment. Whether your brand spans multiple emirates or international markets, KPI frameworks provide the clarity needed for consistent execution. At Octopus, we ensure KPIs do not just monitor past performance but unlock future progress.
Setting Strategic KPIs: From Activity to Outcome
Not all KPIs are created equal. At Octopus, we begin with a KPI workshop—mapping your business goals to measurable indicators. We distinguish between surface activity (likes, impressions, views) and deeper outcomes (engagement quality, lead conversion, audience sentiment, thought leadership traction).
We define indicators for different layers of the funnel—awareness, consideration, conversion, loyalty. We identify campaign-specific metrics, brand health metrics, executive visibility KPIs, and channel performance benchmarks. Each indicator is reviewed for clarity, measurability, strategic relevance, and cadence.
We frame KPIs around brand maturity, audience segmentation, and platform behavior. A startup brand with aggressive growth goals needs velocity-focused KPIs. A legacy brand in repositioning mode needs relevance and perception KPIs. A C-suite executive with thought leadership ambitions needs voice impact and resonance KPIs. KPIs act as the scorecard for your strategic narrative.
KPI Categories and Brand Dimensions
KPIs are organized by strategic domains. Octopus maps KPI ecosystems across several categories including brand visibility, digital engagement, conversion efficacy, content performance, sentiment analysis, and leadership influence.
For brand campaigns, visibility KPIs include reach, share-of-voice, brand lift, and media coverage frequency. For executive brands, we monitor personal post engagement, follower quality, narrative coherence, and invitation velocity. For content platforms, we measure time on content, content shareability, top themes, and subscriber retention.
Each KPI is linked to a strategic business question. Is our message cutting through? Are we reaching the right segments? Are we converting curiosity into contact? Is our leadership brand influencing perception? These questions guide the measurement framework and dashboard development.
We also define internal KPIs for team alignment and operational agility. These include campaign response time, brand guideline compliance, creative revision frequency, and cross-department handoff efficiency. Our KPI approach is holistic, viewing both external impact and internal delivery.
KPI Implementation and Dashboard Design
Tracking KPIs effectively requires the right infrastructure. Octopus develops custom dashboards that consolidate metrics from multiple sources—Google Analytics, Meta Business Suite, LinkedIn Campaign Manager, Mailchimp, SEMrush, and more. We prioritize visual clarity, real-time accessibility, and strategic storytelling.
Our dashboards include narrative annotations, contextual benchmarks, and weekly or monthly movement indicators. Data is structured by decision-making hierarchy—from campaign managers to marketing directors to CEOs. Dashboards are delivered in platforms like Google Data Studio, Notion, or Airtable depending on client preference.
We offer interactive dashboards with filter logic, progress heatmaps, KPI trendlines, and conversion trees. These allow leaders and teams to simulate forecasts, compare performance across campaigns, and align decisions with evolving strategy.
Analyzing KPI Performance and Strategic Interpretation
Raw data does not equal insight. Octopus analyzes KPI performance against goals, expectations, and opportunity cost. We identify what’s working and why. We decode what’s underperforming and what can be optimized. We provide strategic commentary to convert numbers into next steps.
Each KPI is interpreted through brand context. A 5% drop in engagement might be strategic fatigue—or it might signal content dilution. A spike in website visits without lead increase might suggest misalignment in messaging. We ask the why behind the what.
Our team conducts performance reviews that combine hard data with qualitative context. We complement dashboards with brand perception surveys, stakeholder interviews, and creative diagnostics. Our goal is to create a measurement culture, not just a reporting habit.
Optimizing Based on KPI Trends
KPIs are only valuable when they shape behavior. Octopus builds KPI-led optimization roadmaps. We identify campaigns to scale, content to evolve, messages to refine, and platforms to recalibrate. Our optimization plans are not just reactive—they are forward-planning cycles based on historical insights and projected growth.
We help internal teams adapt creative strategies, shift media budgets, and recalibrate tone. We also use KPI performance to inform product marketing, audience research, and future campaign design. Over time, KPIs shift from being checklists to being decision engines.
We revisit performance narratives every quarter to ensure the story we’re tracking still matches the brand’s ambition. We run scenario analyses to understand where KPI shifts can unlock breakthrough performance. In every optimization sprint, KPIs move from being retrospective to being predictive.
Reporting KPIs to Stakeholders
Octopus helps clients present KPI narratives to stakeholders—boards, investors, partners, and leadership teams. We structure reports with strategic language, visual storytelling, and contextual insights. We equip CMOs and founders with presentations that don’t just report—they persuade.
Reports are customized to audience type. A board needs trajectory and risk. A founder wants velocity and visibility. A marketing director needs platform and format insights. Our reports align data language with business language—ensuring every KPI has a role in the broader brand story.
We also build KPI review playbooks for internal reporting. These guide monthly review rituals, team huddles, and retrospective meetings. KPIs become the foundation for team learning, not just leadership reporting.
KPI Evolution and Brand Growth Stages
As your brand grows, your KPIs evolve. Early-stage brands track reach and resonance. Growth-stage brands track pipeline and conversion. Mature brands monitor efficiency, brand equity, and advocacy. Octopus revisits KPI frameworks quarterly to ensure relevance and rigor.
We assess whether your goals have shifted, whether new platforms demand new metrics, and whether internal teams are empowered to act on the data. KPI systems are reviewed, revised, and optimized in line with market behavior and brand ambition.
We support transformation KPIs—tracking the shift in perception after rebrands, mergers, or leadership transitions. We design legacy KPIs to evaluate long-term brand health, narrative continuity, and equity development.
Why Octopus for KPI Strategy in the UAE
Octopus brings strategic discipline, brand fluency, and regional intelligence into every KPI program. We understand what matters across leadership, marketing, and growth teams. We speak the language of data and design. We ensure KPIs connect numbers to narrative.
In the UAE—where business is driven by trust, speed, and transformation—KPIs are your compass. We help you use them to steer, not just measure. Whether you are building a category, repositioning a brand, or expanding market share, our KPI strategies give you clarity and momentum.
Choose Octopus for KPI strategy in the UAE—and let your numbers drive growth, not just reporting.
Let's get started
be part of the future
Outpace your rivals with Octopus Marketing Agency – be the brand that leads, not follows

Got a question? Get your answers
Quick answers to questions you may have. Can’t find what you’re looking for? Check out our full documentation.
01. What are KPIs (Key Performance Indicators)?
KPIs are measurable values that indicate how effectively a business or department is achieving key objectives. They provide a clear focus for strategic and operational improvement.
02. Why are KPIs important in data analytics?
KPIs help businesses track performance over time, uncover trends, and make data-driven decisions that align with organizational goals.
03. How are KPIs used in BI (Business Intelligence) analytics?
In BI analytics, KPIs are visualized in dashboards and reports to monitor performance, compare results across departments, and support timely decision-making.
04.What are examples of common KPIs in data analytics?
Examples include customer retention rate, conversion rate, website traffic, revenue growth, cost per acquisition, and average resolution time.
05. How do you select the right KPIs for a business?
Start with business objectives, then identify measurable metrics that directly reflect progress toward those goals. Ensure KPIs are SMART: Specific, Measurable, Achievable, Relevant, and Time-bound.
06. What is the difference between metrics and KPIs?
All KPIs are metrics, but not all metrics are KPIs. KPIs are the most critical metrics aligned with strategic objectives, while other metrics may support broader analysis.
07.How do BI tools help track KPIs?
BI tools like Power BI, Tableau, and Looker aggregate data from multiple sources and display KPIs in interactive dashboards, making performance tracking easier and more actionable.
08. What is a KPI dashboard?
A KPI dashboard is a visual display of key performance indicators. It offers real-time insights into how departments, teams, or campaigns are performing against targets.
09. Can KPIs be customized for different teams?
Yes, marketing, sales, finance, operations, and HR can all have tailored KPIs that reflect their specific functions and responsibilities.
10. What are KPIs in digital marketing analytics?
Common KPIs include click-through rate (CTR), cost per click (CPC), return on ad spend (ROAS), lead conversion rate, and engagement rate.
11. What are operational KPIs?
These measure day-to-day performance, such as production uptime, order fulfillment rate, customer support resolution time, and supply chain efficiency.
12. How often should KPIs be reviewed?
Review frequency depends on the nature of the KPI. Some (like website traffic) can be monitored daily, while others (like quarterly revenue growth) may be reviewed monthly or quarterly.
13. What role do KPIs play in strategic planning?
KPIs provide measurable targets for long-term strategy, help monitor progress, and support alignment between vision and execution across departments.
14. How can KPIs improve business performance?
By identifying gaps, tracking progress, and encouraging accountability, KPIs drive continuous improvement and better decision-making.
15. What KPIs are essential for startups?
Important startup KPIs include burn rate, customer acquisition cost (CAC), monthly recurring revenue (MRR), churn rate, and product-market fit score.
16. What are financial KPIs in data analytics?
Examples include net profit margin, gross margin, operating cash flow, return on investment (ROI), and accounts receivable turnover.
17. Can KPIs be used in real-time analytics?
Yes, real-time dashboards allow teams to track KPIs instantly, enabling faster responses to emerging trends and issues.
18.What happens if KPIs are not aligned with business goals?
Misaligned KPIs can lead to wasted resources, focus on irrelevant metrics, and decisions that don’t support overall business success
19. What are KPIs in customer service analytics?
Customer service KPIs include average response time, first contact resolution rate, customer satisfaction score (CSAT), and Net Promoter Score (NPS).
20. How can businesses automate KPI reporting?
Using BI tools integrated with data sources, businesses can automate KPI calculations and visualizations, reducing manual effort and improving accuracy.