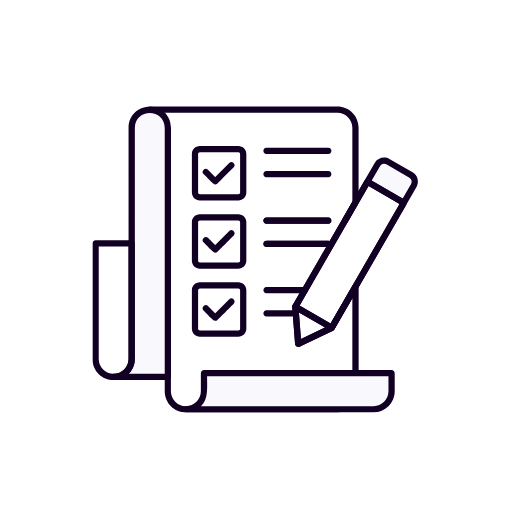
Performance Reports
DATA & BI ANALYTICS > Performance Reports and brand Insights
Performance Reports & Brand Insights
Actionable performance reporting and brand intelligence to track progress, validate strategy, and guide smarter decisions across every touchpoint.
Insight Overload Simplified
We filter noise and focus on what impacts your brand’s growth and direction.
Strategy-Led Analysis
Every metric we report on ties back to your objectives and branding goals.
UAE Business Context
Our reporting reflects regional expectations, benchmarks, and stakeholder formats.
Why Choose Us
Turn Data Into Brand Direction
Our reports don’t just show what happened—they explain why, what it means, and how to act—bridging insights and strategy for UAE-based brands.
“We finally have reports that are actually useful—not just numbers.”
Nader Al Mansoori
―CMO

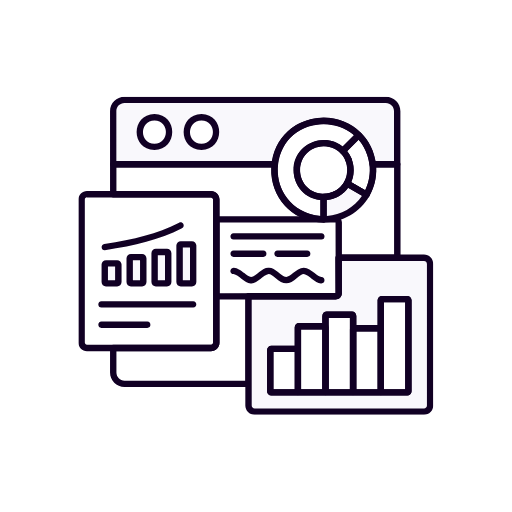
Brand Performance Dashboards
Real-time dashboards and monthly reports that align performance data—across web, campaigns, and content—with strategic brand KPIs and business priorities.
- Always-on reporting
- Strategy-led views

Marketing & Campaign Reports
Our custom campaign reports connect traffic, engagement, and outcomes—making it easy to measure ROI, adjust plans, and report clearly to stakeholders.
- Clear ROI metrics
- Actionable summaries
Our Services
Explore Our Reporting Services
From digital branding and campaign performance to visibility tracking, our performance reports keep your brand informed, focused, and on track.

Website Analytics Reports
Monthly breakdowns of traffic, behavior, conversions, and engagement trends.
Social Media Performance
Insights across Instagram, LinkedIn, and others—mapped against brand goals.
Campaign ROI Tracking
Performance summaries of specific launches, offers, or media investments.

Brand Awareness Metrics
Tracking search visibility, mentions, impressions, and share of voice.
Digital Funnel Insights
User journey reports from first touch to goal completion.

Marketing Channel Breakdown
Segmented performance of each platform or channel with suggested improvements.
Performance Reports
Performance Reports: Strategic Brand Intelligence for the UAE Market
In today’s data-rich but insight-poor environment, brands need more than metrics—they need meaning. Performance reports are not just spreadsheets of activity—they are strategic tools that translate digital behaviors into business decisions. In the UAE’s competitive, fast-moving economy, Octopus crafts performance reports that bridge the gap between analytics and action. We turn dashboards into clarity, KPIs into context, and visibility into value. Our work is deeply rooted in the belief that what gets measured should matter—and what matters should move your brand forward.
Why Performance Reports Matter in the UAE
The UAE’s business landscape is digitally forward and results-driven. Decision-makers—from CMOs to founders to investors—demand proof of impact. Whether you’re running a brand campaign, launching a new identity, managing executive visibility, or building thought leadership, performance reporting enables smart iteration and confident investment.
Dubai, Abu Dhabi, and the broader Gulf markets thrive on accountability, transformation, and strategic growth. In these contexts, performance reporting does not serve merely as a look-back tool—it enables proactive repositioning, audience recalibration, and visibility control. At Octopus, our performance reports blend global best practices with local insight. We track not just reach and clicks, but audience engagement, sentiment trends, narrative alignment, and strategic growth. Every metric is framed by your objectives—ensuring you don’t just measure activity, but progress.
Report Strategy and Framework Design
Before numbers matter, structure matters. Octopus works with clients to define the right reporting cadence, scope, and architecture. We align KPIs with campaign phases, brand goals, funnel stages, and channel functions. We design custom frameworks that distinguish between vanity metrics and decision-grade insights.
Each framework is tailored to your brand architecture. For awareness campaigns, we monitor brand recall velocity and audience penetration. For conversion-led projects, we track behavior funnels, exit rates, and form triggers. For content ecosystems, we measure shareability, repeat engagement, and story flow. Our frameworks are documented, visual, and actionable—designed not just to impress, but to empower.
Channel Reporting and Integration
Modern brands operate across ecosystems—not isolated platforms. Octopus provides integrated, omnichannel reporting that reflects how your audiences interact, move, and decide. We aggregate performance insights across social platforms, websites, email tools, search engines, and paid channels. Our methodology interprets signals across LinkedIn engagement spikes, Instagram sentiment curves, blog dwell time, email open trends, and click-to-contact momentum.
We understand that a social post is only as strong as its follow-through. Our reports connect the story—from impression to inquiry, from narrative resonance to behavioral conversion. We track and interpret user journeys holistically, providing strategic clarity across complex marketing touchpoints.
Brand and Campaign Health Indicators
Numbers mean little without narrative. We analyze metrics through the lens of your brand architecture. Octopus evaluates the health of campaigns and platforms using both hard metrics and qualitative signals. Are your brand pillars being activated? Are your content themes gaining traction? Are your values reflected in audience interaction? We examine performance through campaign relevance, audience retention, strategic voice alignment, and sentiment polarity.
For brands undergoing transformation, we compare legacy performance to refreshed activity. For startups scaling visibility, we benchmark growth velocity against category norms. Every data point is contextualized—every insight traced to impact.
Quarterly and Monthly Report Systems
Different cadences drive different decisions. Octopus offers both monthly and quarterly reporting formats, each with tailored depth. Monthly reports provide fast iteration: what to adjust, where to reinvest, and how to sharpen language. Quarterly reports drive big-picture shifts: platform decisions, budget reallocations, persona recalibrations, and campaign redesigns.
Each report includes a narrative executive summary written by Octopus strategists—not just a table of figures. We translate data into direction. Strategic commentary outlines what to continue, what to pause, and what to evolve. Trendlines and benchmarks are visualized, not just listed. Our reports are designed to be read, referenced, and reused by marketing, leadership, and investor teams alike.
Executive Visibility and Personal Brand Reporting
For executive branding, performance reporting requires nuance. Octopus tracks metrics that matter to influence: post resonance, audience growth by tier, engagement quality, and thought leadership amplification. We evaluate LinkedIn reach in context—how did sentiment shift, what topics triggered community interaction, where did industry alignment emerge?
We also assess visibility in earned media, speaker events, and partner platforms. Performance is not only measured in volume—but in voice ownership. Our executive reporting includes headline narrative alignment, reputation coherence, profile optimization trends, and visibility gaps. For founders, board members, and advisors, we offer personal visibility maps that inform strategic appearance planning.
Custom Dashboards, Tools, and Presentation Formats
Octopus builds custom reporting environments for internal and external use. Whether your team works in Notion, Airtable, Google Data Studio, or Figma, we deliver reports in the language and layout you live in. Dashboards are modular, dynamic, and branded. Data is organized by stakeholder relevance: C-suite decision points, marketing team optimizations, sales opportunity signals.
We also provide snapshot decks, investor reporting slides, and campaign recap summaries. Every format is designed to simplify the signal-to-noise ratio—making complexity readable and insight actionable. Reports are layered by zoom level: top-line KPIs, mid-line insights, bottom-line implications.
Stakeholder Readouts and Collaborative Reviews
Performance reporting should not live in PDFs alone. Octopus supports live reporting sessions—strategy workshops, stakeholder reviews, leadership briefings. We facilitate conversation between data, design, and decision. Reports become moments of alignment, not just measurement. We coach internal teams on reading performance critically, not just passively. Our review sessions drive roadmap updates, creative revisions, and go-to-market shifts.
Thought Leadership and Content Impact Analytics
For brands investing in long-form content, education platforms, or thought leadership ecosystems, reporting goes deeper. Octopus builds content impact frameworks that track knowledge equity—not just engagement. We map visibility spikes to calendar events, content cadence to platform lift, and speaker appearances to audience sentiment.
We evaluate share depth, peer commentary, quote replay, and thematic traction. Reporting here is narrative intelligence: how well is your thinking being adopted, referenced, or challenged? Are your key ideas shaping the space—or blending into the noise? These questions are tracked, visualized, and fed into future content decisions.
Post-Report Action Planning and Optimization Cycles
Data without action is decoration. Every Octopus report ends with an optimization agenda. We translate insights into tests, timelines, and tasks. Content formats are updated, targeting is recalibrated, budgets are shifted, creative briefs are adjusted. We integrate reporting with creative, UX, media, and strategic teams to ensure performance becomes a shared priority—not a siloed one.
Over time, our clients evolve from being content producers to performance-led storytellers. Our reporting rhythm creates a feedback loop where insight meets iteration.
Why Octopus for Performance Reporting in the UAE
Octopus fuses creative clarity with data precision. Our performance reports are built by strategists, designers, and content specialists—not just analysts. We know how to interpret, visualize, and act on data that moves brands forward. We don’t just track—you evolve.
Our UAE market understanding gives us the cultural nuance and business relevance needed to contextualize global platforms within regional behaviors. Whether you’re presenting to a boardroom in DIFC or optimizing a campaign for Jumeirah-based audiences, our insights are tuned to your audience and ambition.
Choose Octopus for performance reporting in the UAE—and let every metric become a strategic advantage.
Let's get started
Don't get left behind
Stay ahead of the competition with ReachOut – don’t get left behind.

Got a question? Get your answers
Quick answers to questions you may have. Can’t find what you’re looking for? Check out our full documentation.
01. What should a good performance report include?
A solid report includes KPIs, visual dashboards, campaign summaries, budget utilization, audience insights, and action items. It often compares current results with past performance or benchmarks. Custom segments for UAE-specific audiences or platforms like Meta and Google are also common.
02.How often should performance reports be generated?
Weekly for paid ads and fast-moving digital campaigns, monthly for branding and SEO, and quarterly for strategic reviews. Real-time dashboards are also popular for on-demand visibility. The frequency depends on goals, budgets, and the reporting platform used.
03. What is the cost of performance reporting services in Dubai?
Basic automated reports can be included in retainers, while detailed strategy reports with insights, visuals, and recommendations range from AED 2,000–10,000/month. Pricing varies by platform, customization level, and reporting frequency.